
CdZnTe boule section
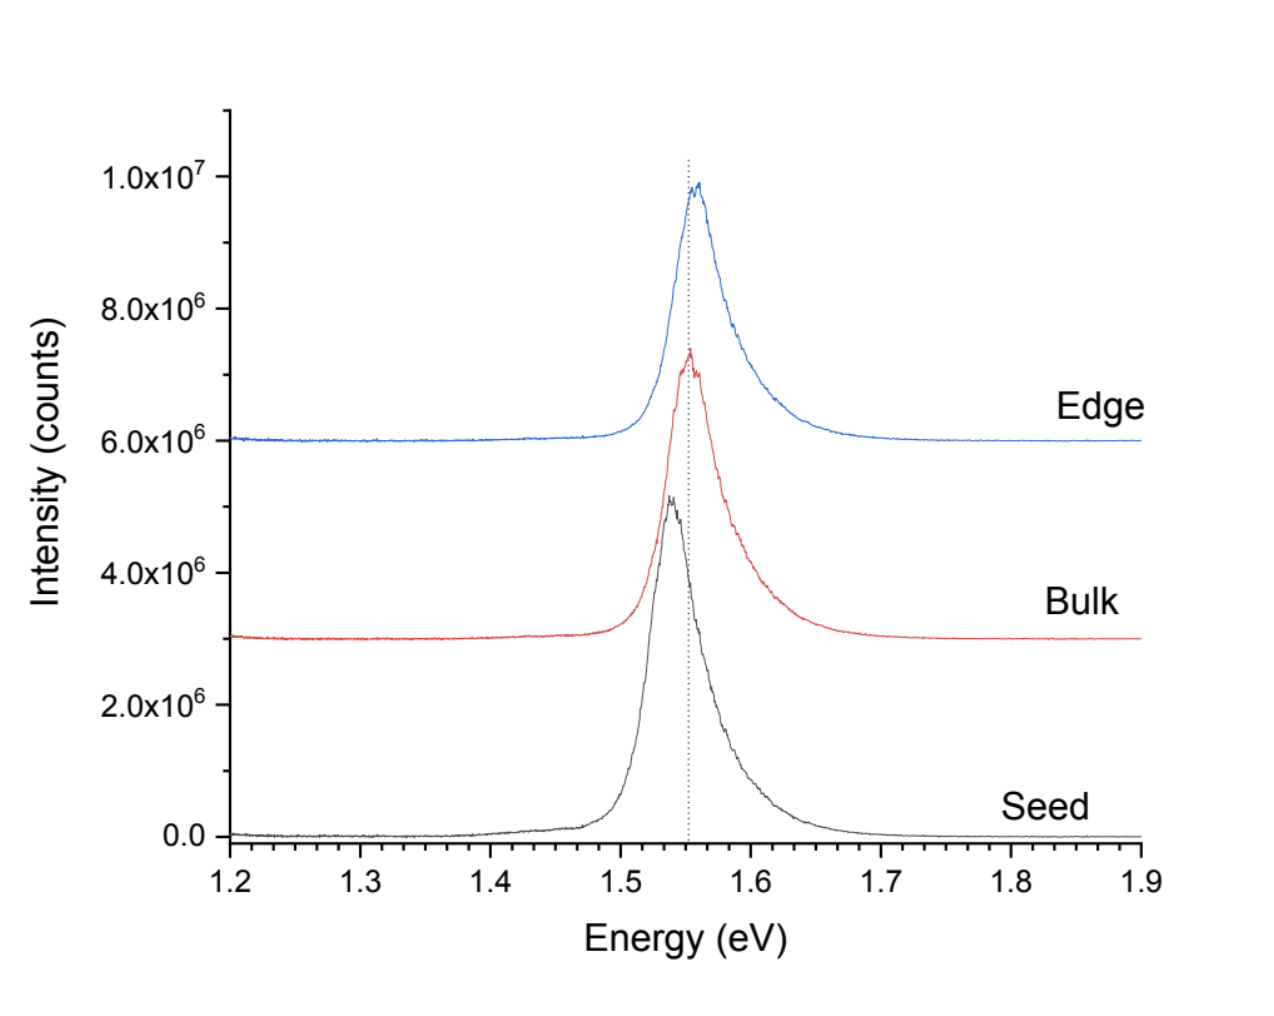
PL
532 nm diode kit, 60 ms integration time.
The shifts in the peak energy correspond to changes in the Zn concentration from region to region. The energy shifts from different regions clearly show the changes in Zn incorporation. Spectra are offset for clarity.
Sample courtesy of Santosh Swain, Washington State University

Wafer from the CZT boule