
A Compact, Affordable Instrument Designed for Individual Labs
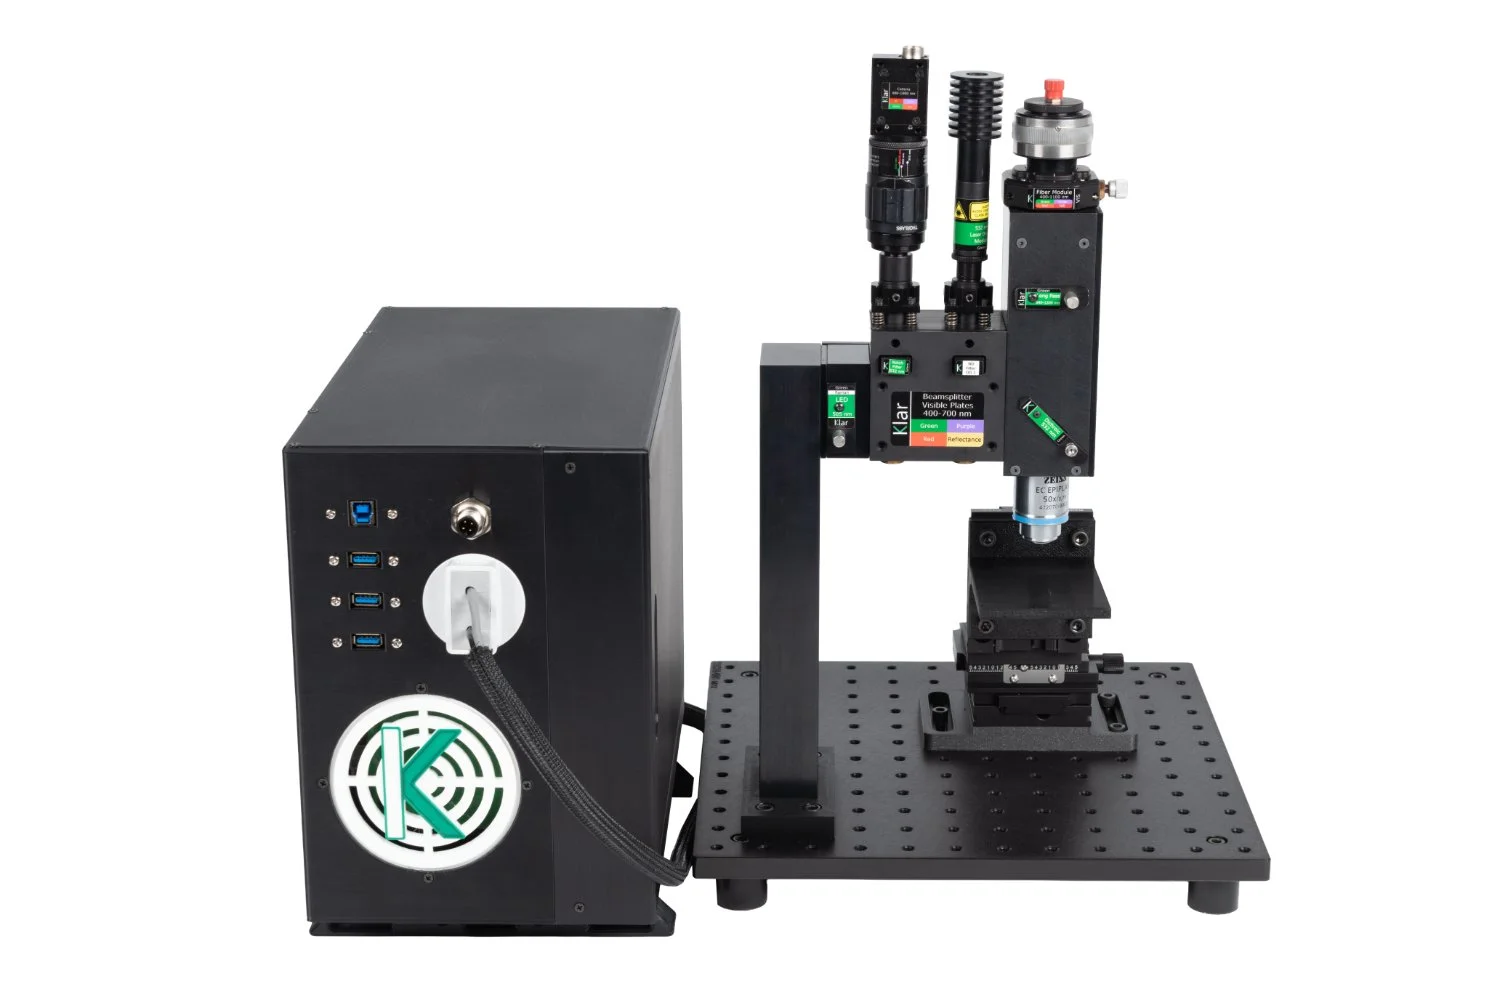
Standard
PL Microscope
Klar’s Standard Microscope is ideal for the individual user seeking spectra from their materials. “Where are the peaks? What’s the relative intensity of the peaks? What’s the band gap?”
The Standard Microscope is a compact, affordable instrument designed for individual labs. Point and shoot, acquire a spectrum.
Contact Us for a Standard Microscope system quote..
-
Light excitation 349 to 975 nm
Configurable spectral range 349 to 2500 nm
Diffraction limited spot size
Compact footprint (1 sq. ft.)
Ready to go instrument*
Highly adaptable to your experimental needs
Use with virtually any sample
Add optical spectroscopy to your lab and experimental process
Customize using standard optical components
Compatible with the Thorlabs cage rod system
Raman option available
*with purchase of spectrometer and kit
-
The Standard’s universal optical design allows the owner to expand capabilities with user-replaceable wavelength kits.
Spectroscopy from the near-IR to the deep-UV (1700-349nm)
Change kits in less than 5 minutes
Custom kits available
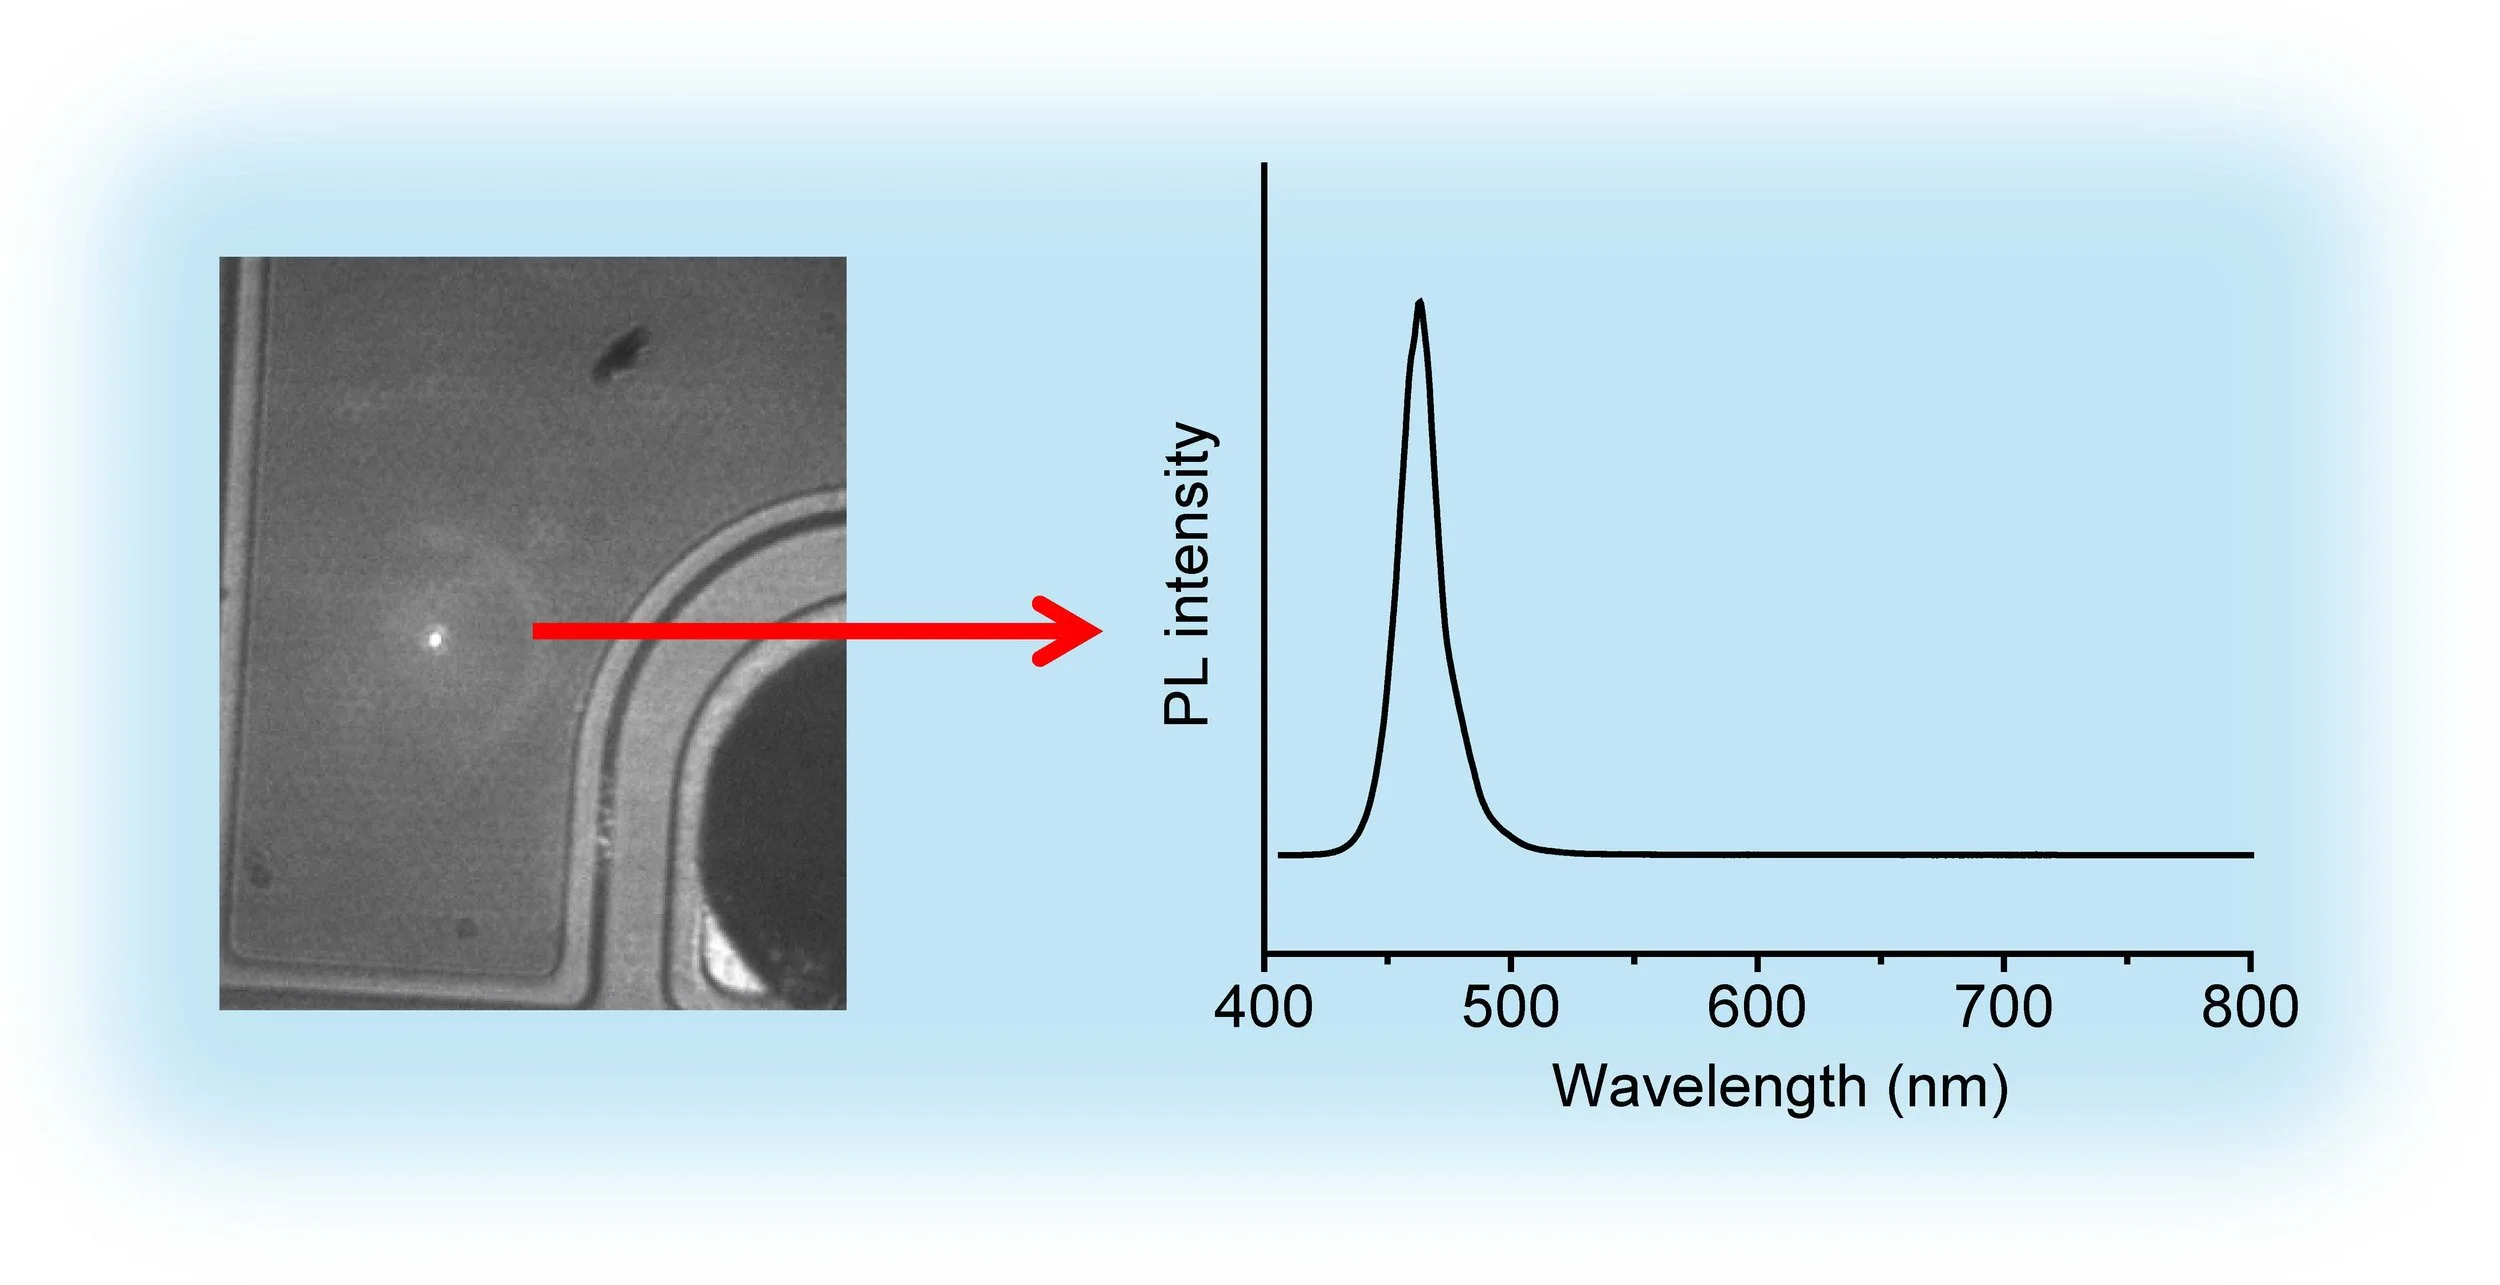
Get a Spectrum from a Specific Spot on your Sample
Discover what is going on inside your material.
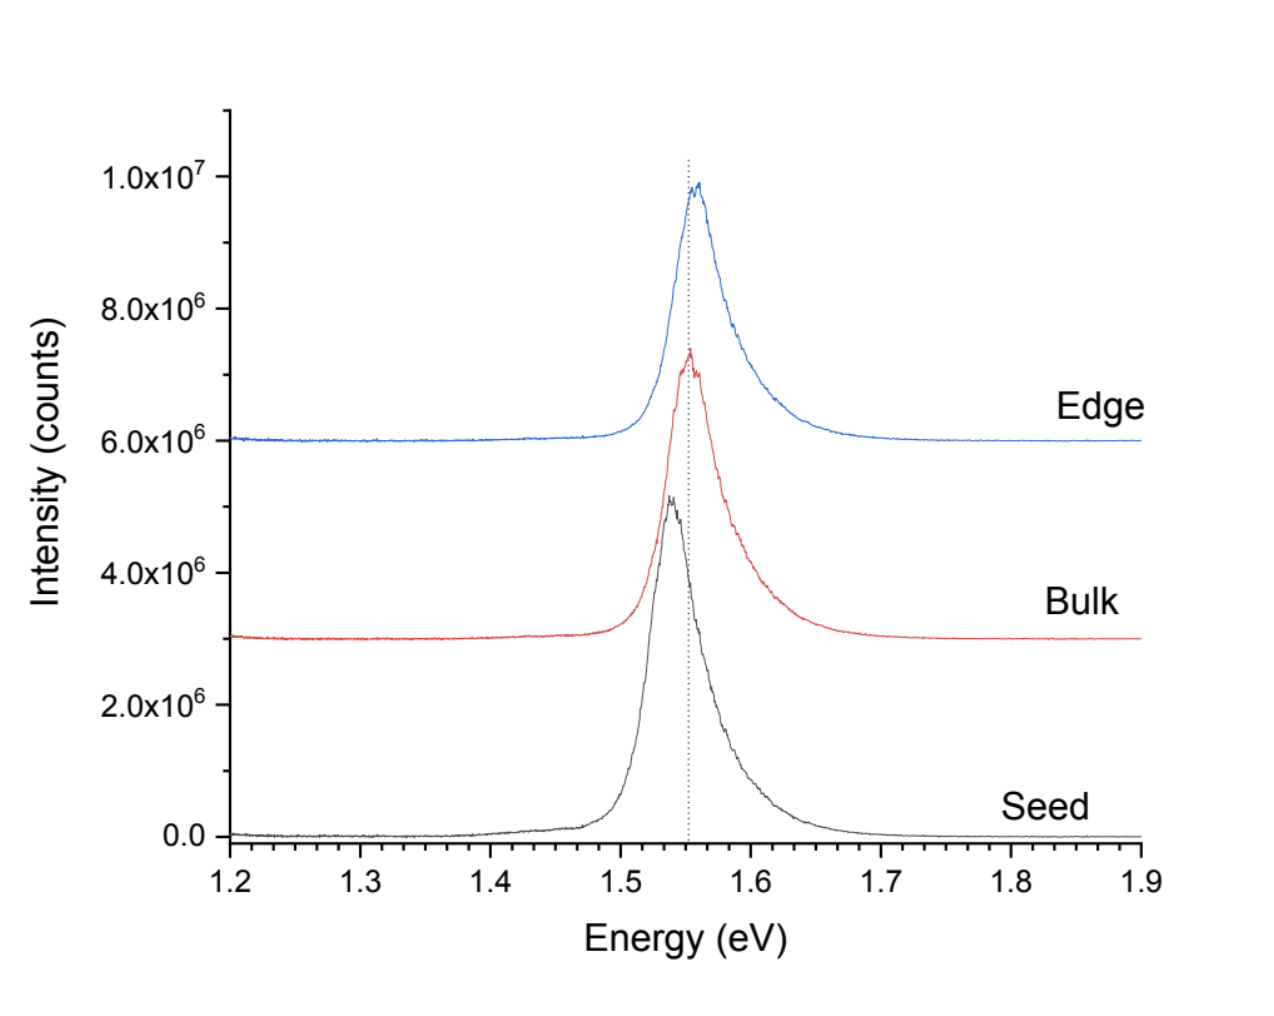
CdZnTe boule section
PL
532 nm diode kit, 60 ms integration time.
The shifts in the peak energy correspond to changes in the Zn concentration from region to region. The energy shifts from different regions clearly show the changes in Zn incorporation. Spectra are offset for clarity.
Sample courtesy of Santosh Swain, Washington State University

Wafer from the CZT boule