Data Analysis
GPU-Accelerated Analysis
A PL or Raman scan collects the spectrum of emitting light from each point sampled over a two-dimensional region. A sample with many layers generally has a spectrum with a peak originating from each layer. The wavelengths at which the peaks occur are the bandgaps of the layers. A map of those intensities or wavelengths can reveal the uniformity of the layer, the location of defects or dislocations, the presence of contaminants, the concentration of dopants, or evidence of damage from the sample’s fabrication process. This information is vital for the material scientist and device engineer seeking relationships between growth, process, and performance.
Klar Fit, the principal algorithm for analyzing a PL or Raman scan, enables extraction of the peak intensities, their spectral location, the width of the peaks, and other information, and creates customizable maps. Klar Fit uses GPU-accelerated peak fitting to a function selected by the user from an extensive library or to a custom fitting function created by the user. Fitting of millions of spectra, each with up to 2048 wavelength samples, can be accomplished in under an hour. Klar Fit has been used to analyze maps of a wide variety of materials and structures. It is easy to set up and provides a unique and powerful method for discovering essential properties of materials.
Klar Fit directly reads binary files created by Klar’s instrument operating system, Klar Spec. It is also capable of analyzing client data obtained by other methods. Contact us for details.
Klar Fit can export data into many formats for further analysis and processing by other software, such as Matlab or Python codes.
If you have a multilayered, two-dimensional sample and want to ‘look’ inside each layer, use Klar’s microscopes to scan the samples and Klar Fit to analyze and map the spectra. It’s simple and fast to use. Even rough samples may be analyzed by ensuring Klar’s autofocus is running during the scanning process.
Millions of Spectra Can Be Fit in Under an Hour
Klar Fit data analysis software is a powerful, versatile spectral peak-fitting and data presentation package. This software was specifically designed to handle the large datasets collected by our microscopes, where a map could consist of over a million spectra each composed of thousands of values.
Utilizing the massively parallel computing capabilities of Graphical Processing Units (GPUs), this software is capable of processing and presenting those data in minutes.
High-Speed Analysis
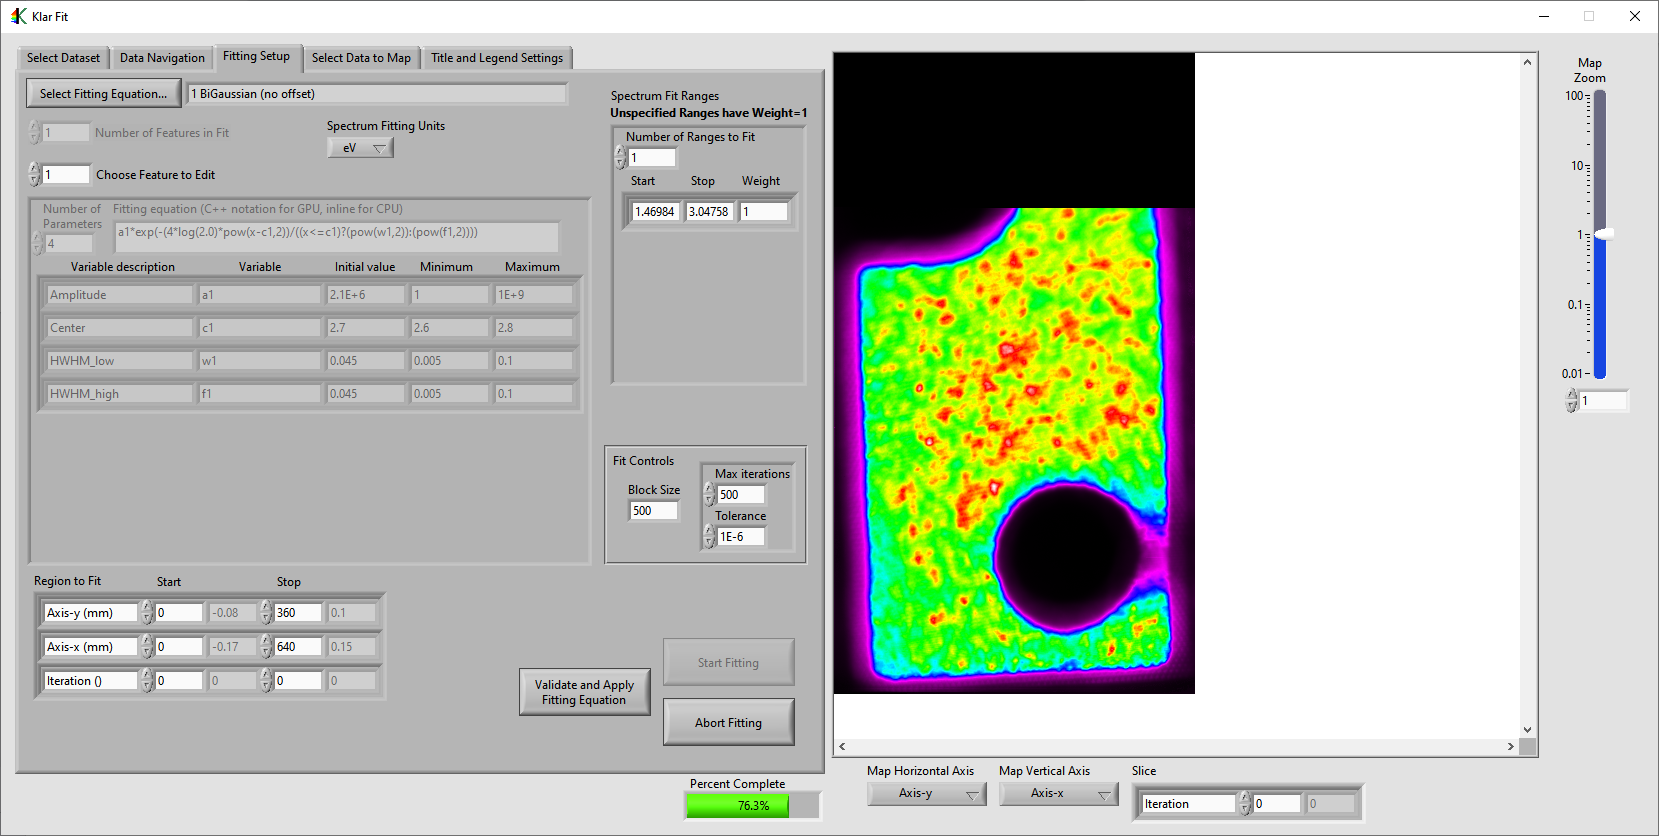
Klar Fit doesn’t just plot intensity. It can perform least-squares fitting of any number of spectral features, using equations that are best suited to the problem.
The figure below shows a PL map generated by Klar Fit. The PL peak was modeled as two overlapping Gaussians (6 parameters total). To benchmark the performance, Klar Fit performed the analysis using a CPU and a GPU. The CPU (Intel 6-core i7-8700) did 47 fits/sec. The GPU (NVidia GTX 1080 Ti) did 10,056 fits/sec.
High-Quality Display
Klar Fit Provides Three Methods for Displaying Publication-Quality Data

Mapping One Equation to a Color Bar.
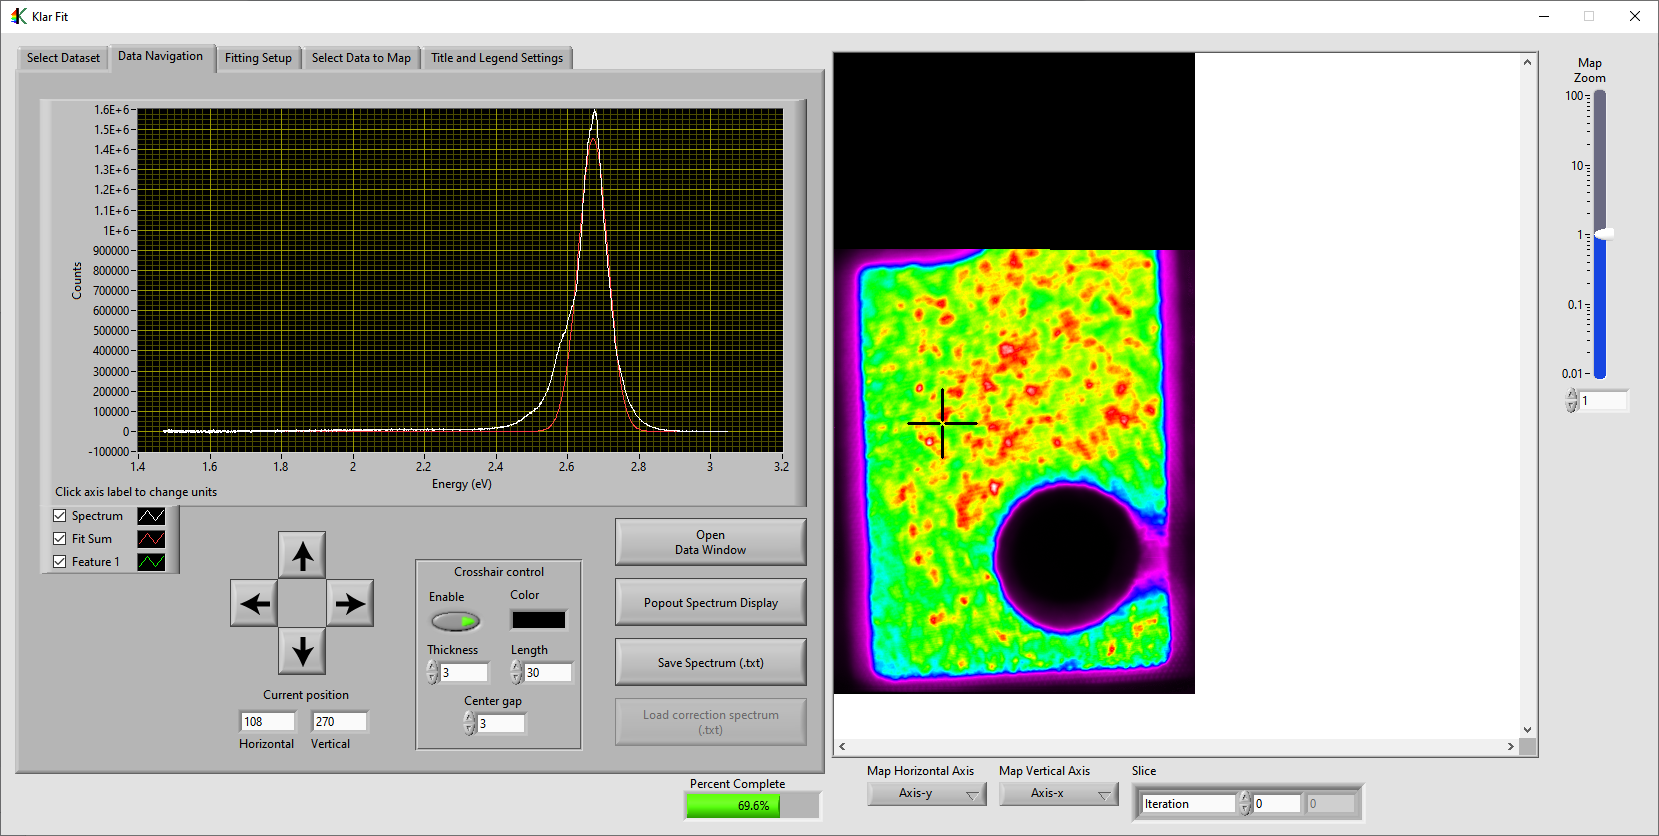
The user defines an equation that involves the fitted parameter(s). This equation could just be a parameter, like peak width, or something more complex. The result of that equation is plotted using a built-in color bar. Users can also define their own color bars for a customized appearance. The figure shows a plot of one parameter, the peak center.

Color Representation of Up to Three Equations.
Here, the results of up to three equations are orthogonally mapped onto Red, Green, and Blue intensities. At a glance, different spectral features are made apparent. In the figure, the intensity of the narrow peak is mapped to Red while that of the broad peak is mapped to Green and Blue.

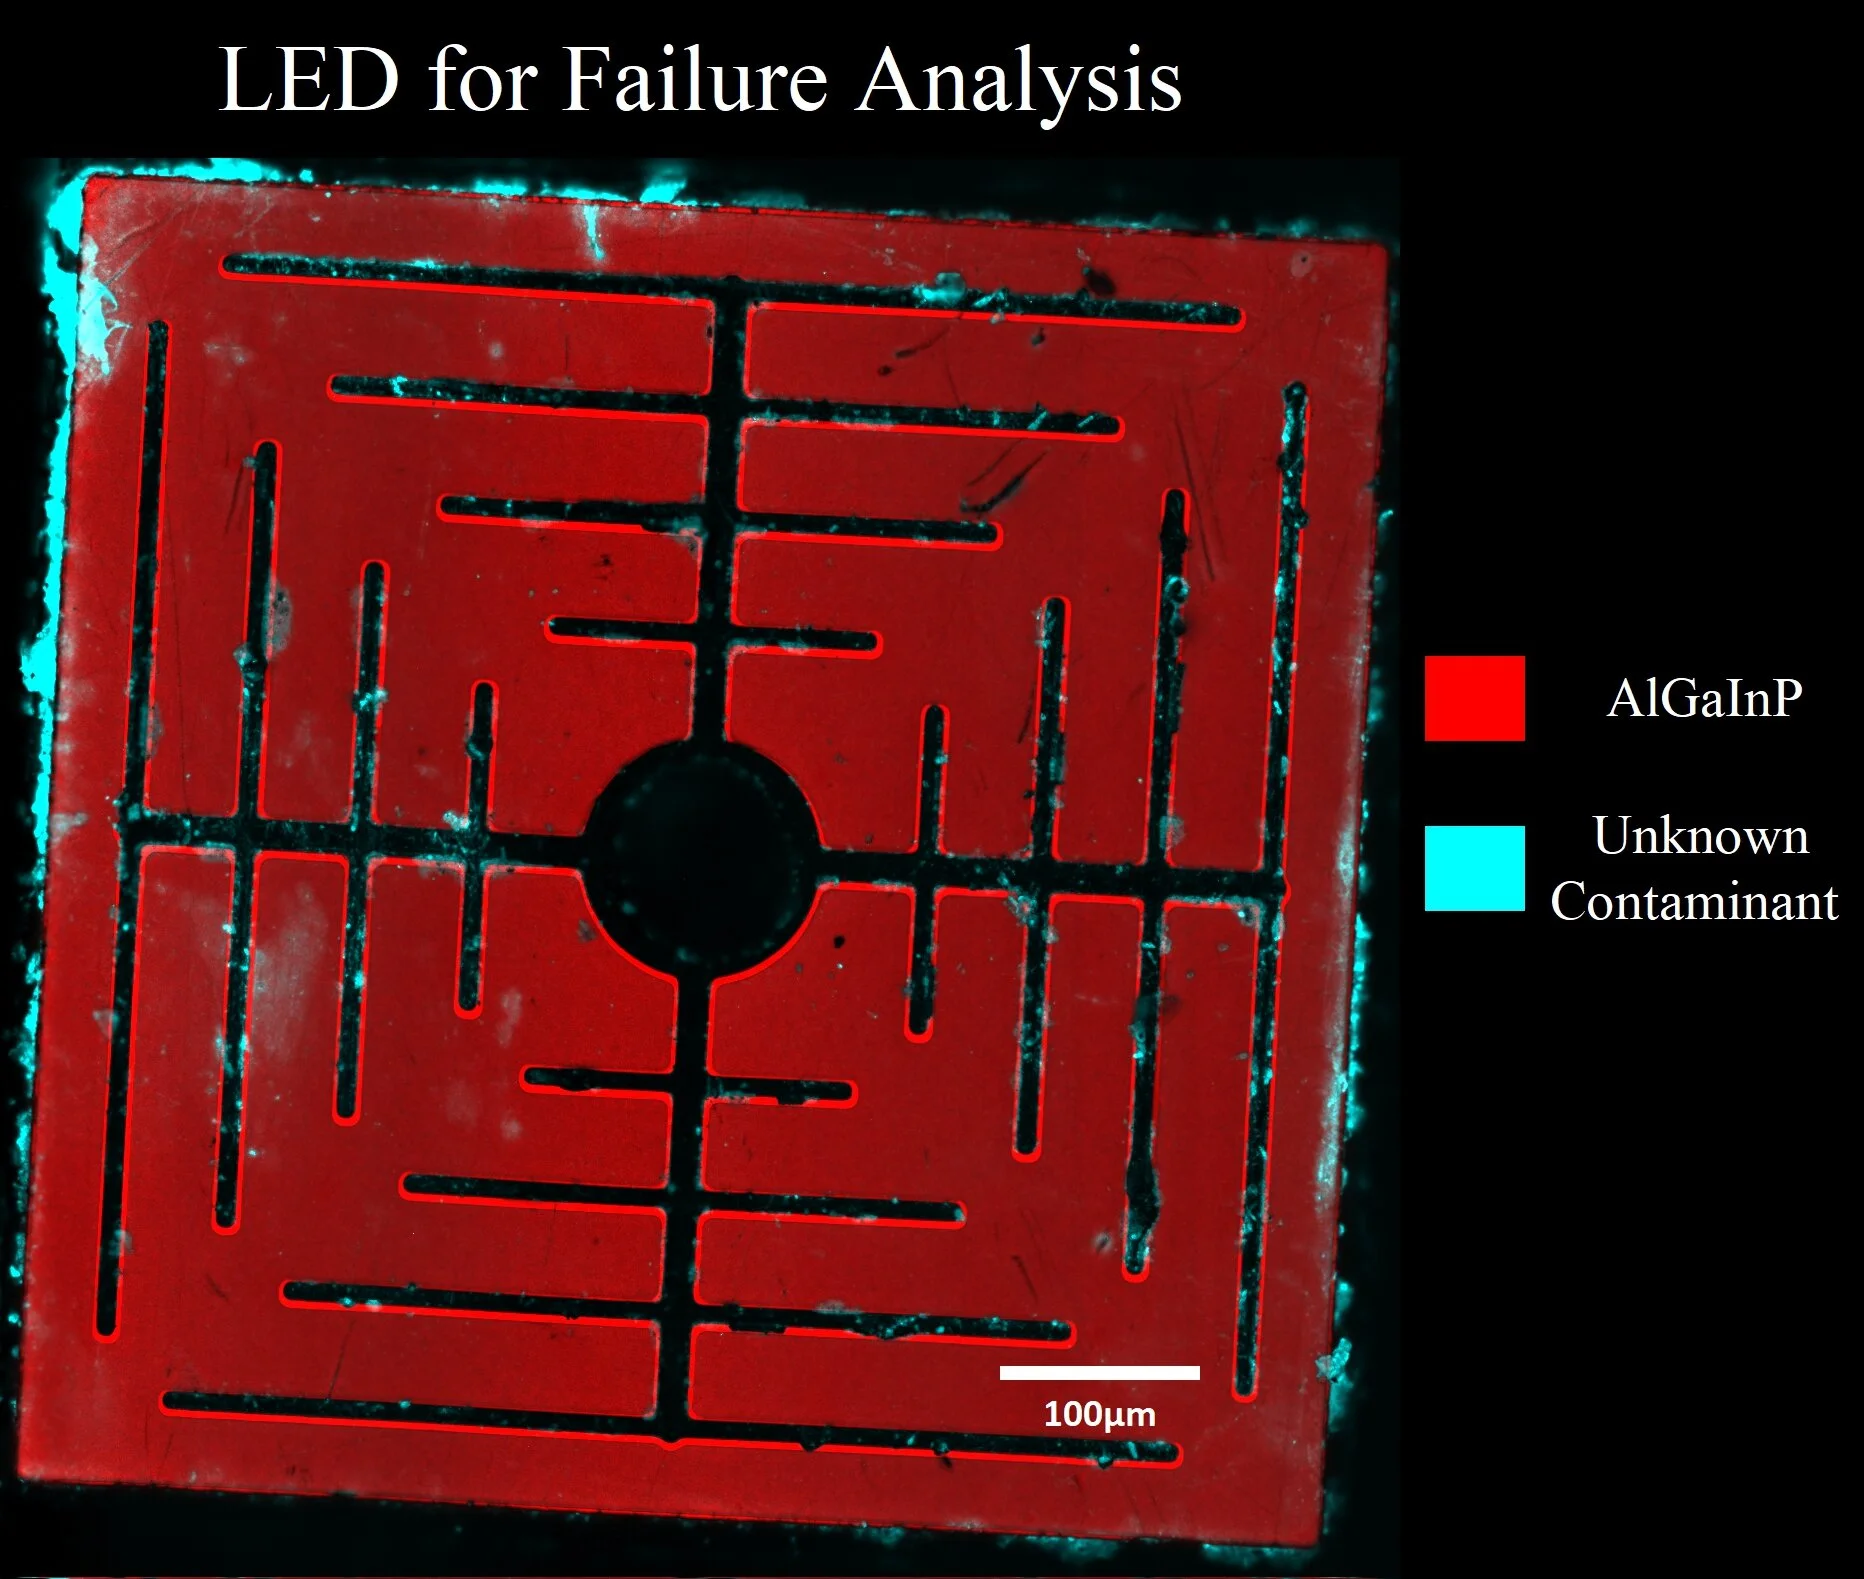
Equations mapped to solid colors.
An arbitrary number of conditional (Boolean) equations can be mapped to solid colors. This is great for emphasizing regions that have similar characteristics.