Multi-Scanning
Capture Photoluminescence (PL) and Raman Mapping
with the Same Instrument
With a Klar microscope, you can scan and then re-scan using a
different wavelength, spatial resolution, or method.
A Klar Microscope Case Study using Scan and then Re-Scan Method:
A deep-UV (266 nm) PL scan was performed to investigate gallium oxide (β-Ga2O3) epilayers that had been previously damaged by high-intensity laser pulses. Excitation with the 266 nm laser produced the characteristic UV band for β-Ga2O3 (Fig. 1).
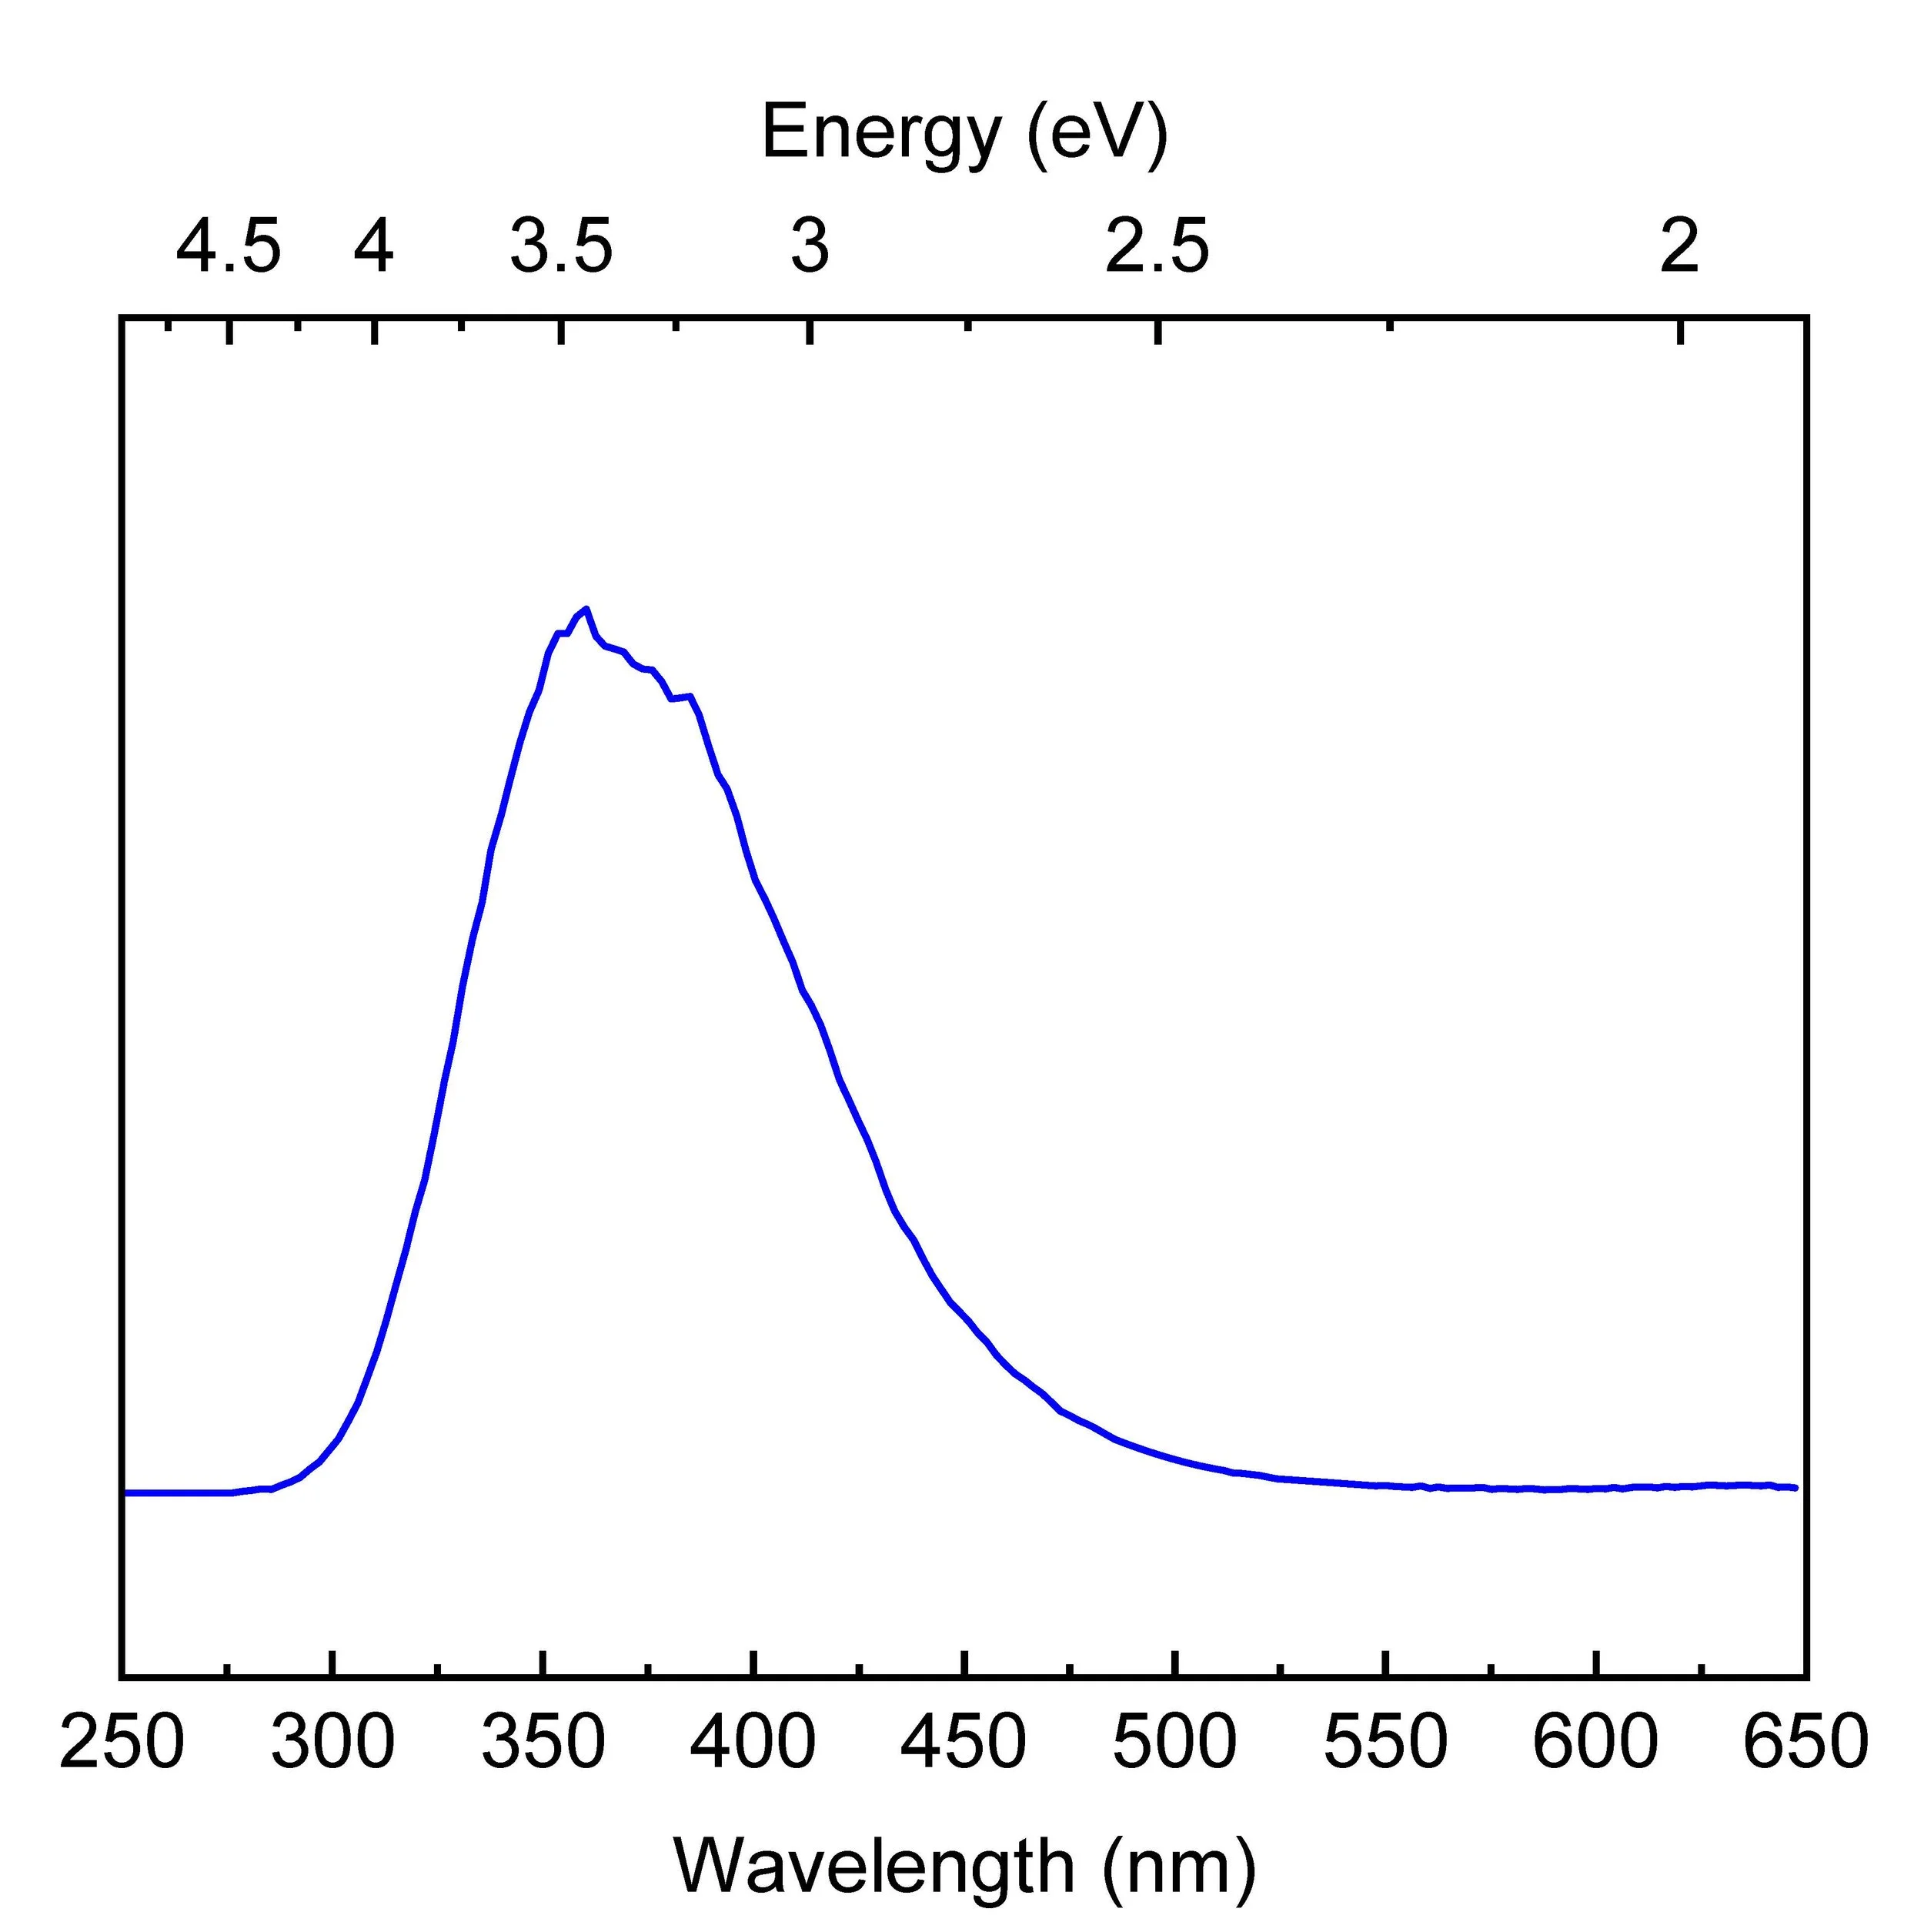
Fig. 1. PL spectrum of gallium oxide (266 nm excitation), showing the characteristic UV band.
The intensity of this UV band is plotted as a false-color image in Fig. 2(a). Circular damage regions show lower UV PL intensity than the surrounding material due to nonradiative defects.
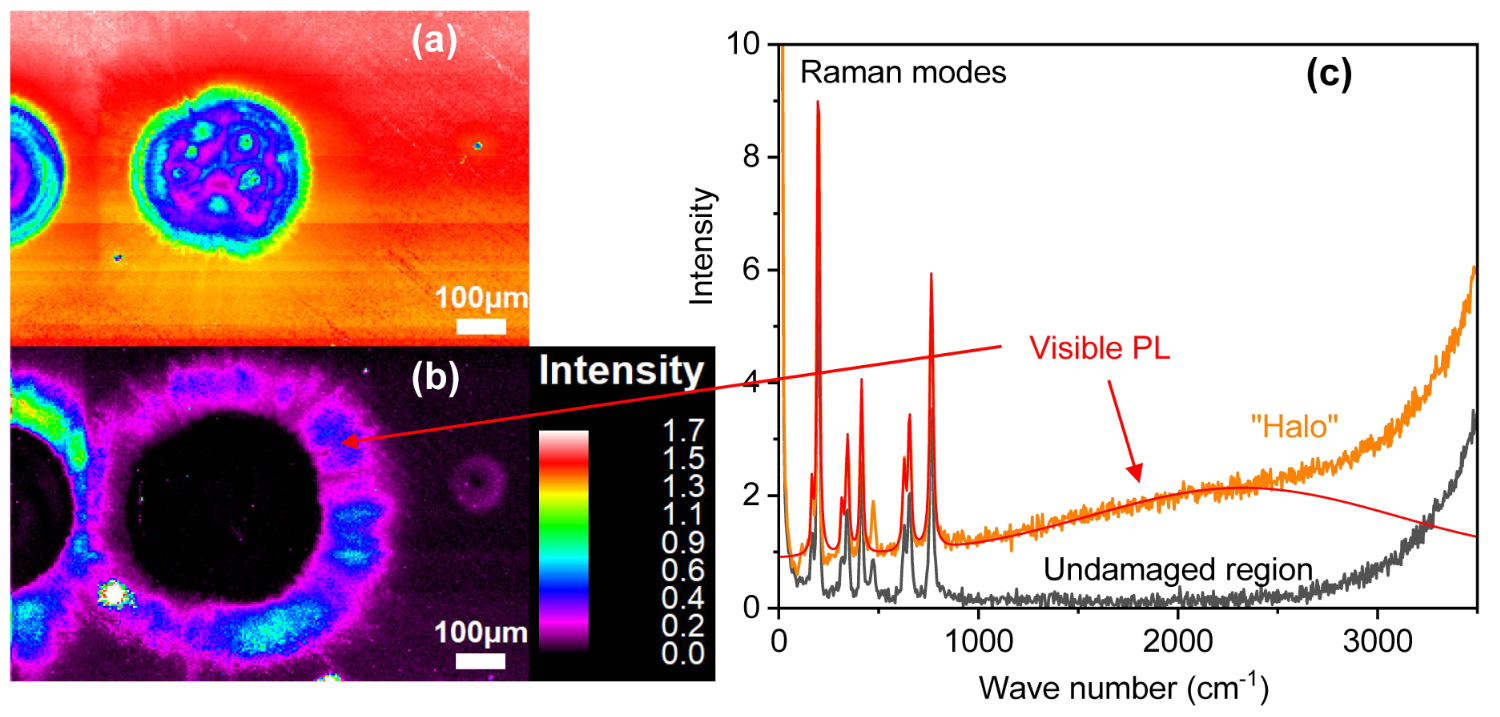
Fig. 2. PL and Raman maps of β-Ga2O3. (a) Intensity of the UV PL band. (b) Intensity of the visible PL band observed in Raman spectra. (c) Raman spectra of the halo and undamaged regions.
After taking the PL scan, Raman spectra were taken using a 532 nm laser. The Raman spectra showed, in addition to the β-Ga2O3 Raman modes, visible PL in the orange region of the spectrum. Plotting the intensity of the visible PL revealed “halos” around the circular damage regions. The investigators proposed that these novel features were caused by point defects blown into the surrounding material.
For Reference or to read full research article:
J. Huso, M.D. McCluskey, J.S. McCloy, A. Bhattacharyya, S. Krishnamoorthy, C.D. Frye, J.B. Varley, and L.F. Voss, Photoluminescence mapping of laser-damaged β-Ga2O3, MRS Commun. 14, 427-431 (2024).