
GaN on SiC
Raman
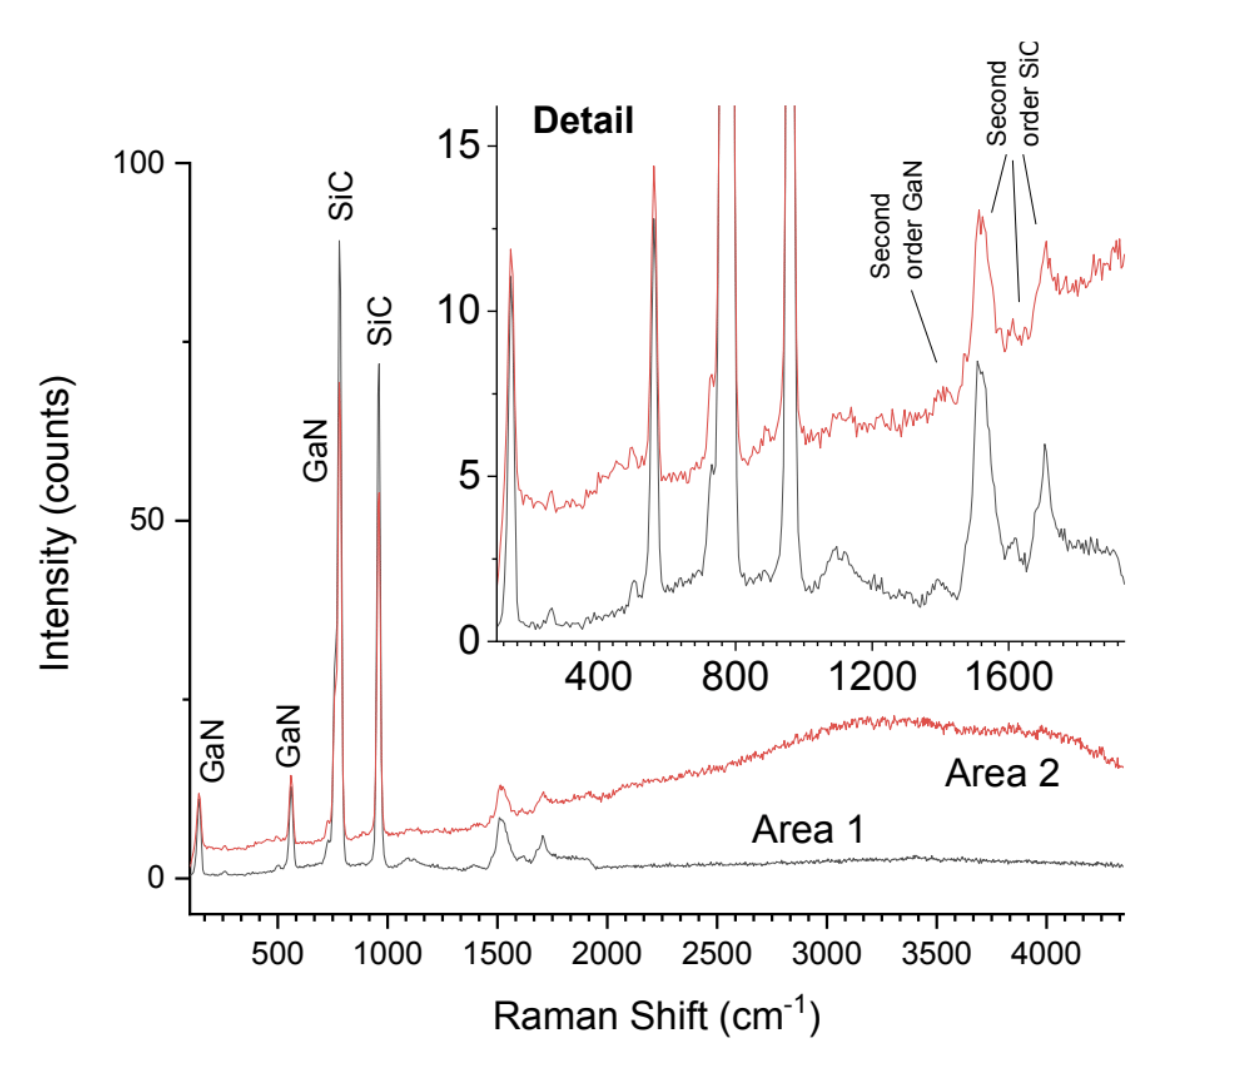
Raman spectra collected with the 532 nm Raman kit. The spectra clearly show both the SiC and GaN peaks. In addition, the sensitivity of the instrument is demonstrated by clearly obtaining the weak second order scattering peaks even at a short integration time.
10 ms integration time.
Sample courtesy of Georges Pavlidis, University of Connecticut